Spotlight › Sheet and Chart
A spreadsheet, and something to chart it with
Sheet is a workbook of four worksheets with formulas, formats, sorting and a macro language. Chart draws the numbers. Both target Microsoft Excel 2.1 from 1989, in what they do and in how they look.
- each worksheet
- 256 x 16,384 cells
- functions
- 25
- chart types
- 7
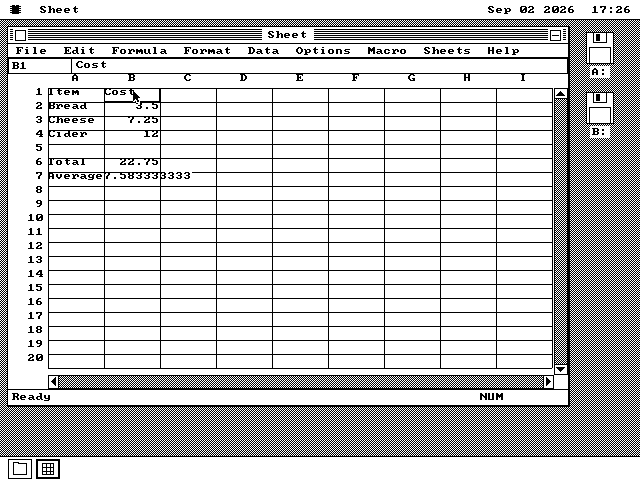
What Sheet does
More than the screenshot suggests.
Four worksheets
One document holds four, each 256 columns by 16,384 rows. Cells are stored only where something has been typed, so an empty sheet costs nothing.
Formulas
25 functions, absolute references, and error values when something cannot be worked out. A formula that refers back to itself is caught rather than left to spin.
Formats
Number formats, alignment, bold and italic, cell borders, and notes attached to a cell. Column widths and row heights.
Editing
Copy and paste a block, fill right and fill down across a selection, and a Sort that moves whole rows rather than the one column you picked.
A macro language
Five commands, enough to fill cells, move around and recalculate without typing.
The look
The menu bar is inside the window, the reference box and formula bar are above the grid and the word "Ready" sits below it. That is Excel 2.1, checked against the manuals and against the real program running in a virtual machine.
The numbers are real
And they were not, at first.
Sheet began with whole numbers only, because that is what an 8088 can add. A spreadsheet that cannot hold 3.5 is not a spreadsheet, so the arithmetic was replaced.
Cells now hold decimals to about fifteen digits. 1/3 is 0.3333333333.
SQRT(2) is 1.41421. The average of 3.5, 7.25 and 12 is 7.583333333, and it
prints that way.
Done in software, or by a chip if there is one
The 8088 has no hardware for this kind of arithmetic. Every addition, multiplication and square root is worked out by code, one step at a time.
Some PCs of the period had an 8087 fitted, an optional chip that did this arithmetic directly and much faster. Sheet looks for one when it starts and uses it if it is there. Both paths are tested against the same set of cases on every build, and both must give the same answers.
Chart
Two programs, one drawing engine.
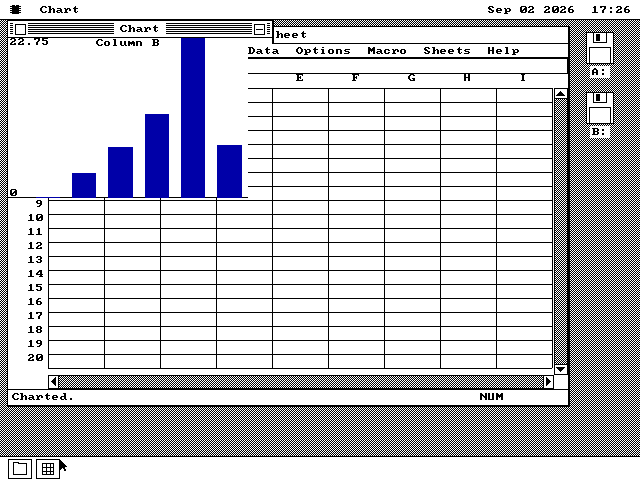
Chart is a program in its own right. Give it a spreadsheet file and it draws one of seven kinds of chart from it -- the same seven Excel 2.1 offered.
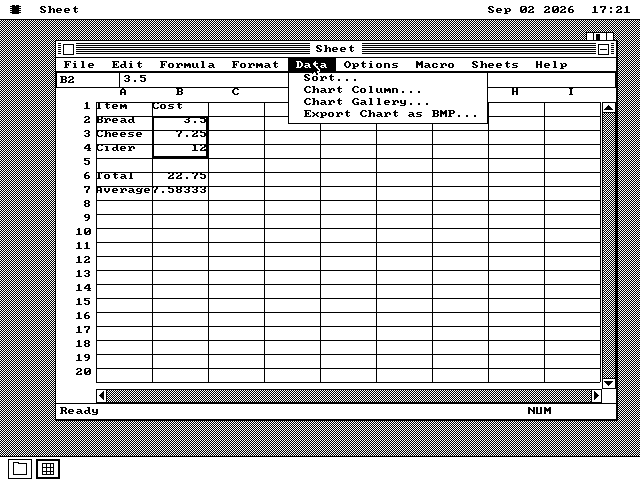
Sheet has a chart window too, opened from the Data menu on whichever column is selected. Both draw through the same code, so the two cannot end up disagreeing about the same numbers.
Why it draws into memory first
A chart is drawn into a private picture in memory and then put on screen in one go. That is not a speed trick. There is no way in os8088 to read pixels back off the screen, so a chart drawn straight onto the glass could never be saved. Because the picture exists in memory, Export Chart as BMP is a single write of bytes that are already in the right shape -- and the saved file is guaranteed to be the chart you were looking at.
Getting files in and out
Three formats, all from the period.
Sheet reads and writes SYLK, DIF and BIFF. These are the file formats 1980s spreadsheets used to hand data to each other, and Excel still opens all three, so a file can go from this machine to a modern one and back.
Formulas survive the trip in SYLK and BIFF, as formulas rather than as the numbers they happened to produce. DIF has no way to express a formula, so it carries the values -- that is the format's limit, not Sheet's. A BIFF file can hold all four worksheets at once.
Sheet claims the .SLK, .DIF and .BIF extensions, so
double-clicking a spreadsheet in the file manager opens it. Save As asks which format you
want rather than guessing from the name you typed.
Run it yourself
Both are on the ordinary software disk.
- Download
os8088.imgandapps.imgfrom the releases page. - Boot the first in drive A: with the second in drive B:.
qemu-system-i386 -drive file=os8088.img,format=raw,if=floppy -boot a \ -drive file=apps.img,format=raw,if=floppy,index=1 \ -chardev msmouse,id=m0 -serial chardev:m0 - Double-click the drive B: icon, then the
APPSfolder, thenSHEET.O88.CHART.O88is in the same folder. - Type a few numbers into column B, select them, and pick Chart Column from the Data menu.